July 24, 2025/
No Comments
History of the Information Radiators : 1980s – Visual Management: The concept of visual control and visual management originated in Japan...

1980s – Visual Management: The concept of visual control and visual management originated in Japan from Toyota Production System ( TPS ) or Lean Manufacturing. Visual Management or ‘Mieruka’ in Japanese is one of the foundational principle in TPS.
Late 1990s – Informative Workspace with BVCs Kent Beck who is known as father of Extreme Programming (XP), an agile methodology coined the term Big Visible Charts ( BVC). Informative workspace ( is one of the primary practices recommended in XP, that endorse use of BVCs.
Fig 1 : Agile team space with Digital boards and BVCs
Early 2000s: The term information radiator is attributed to Alistair Cockburn. He used radiator as a metaphor. Radiators as seen as items that emit some form of heat, light, or sound. When it comes to Agile information radiators, information is being emitted.
Information Refrigerator Vs Information Radiator
When we store information in a folder or in a database , it is called as information refrigerator . Too much information, irrelevant information is as bad as no information. The information in the form of information refrigerator requires extra effort to be pulled as they are not instantly visible. While information radiators are visible piece of vital information. Agile recommends vital project data to be always in front and centre.
1. Product Road Maps : These are visual overviews of product’s releases and release points. Product owners creates product map to visualize how the solution will evolve over time. It is essential to communicate the road map to the team in order to ensure the team understands the product vision and direction and the changes in the product map.
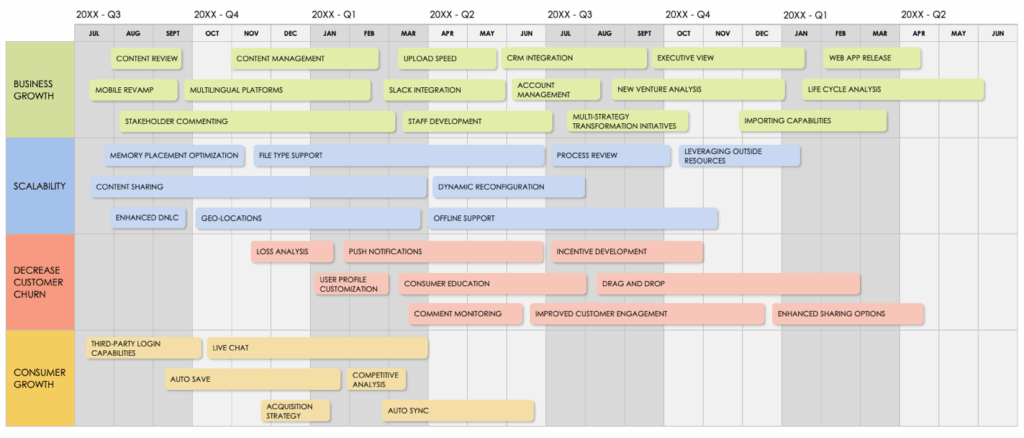
Fig 2 : Product Road Map
2. Kanban Boards :Kanban is a Japanese term that means sign board.
Kanban system were first used in Toyota as a visual scheduling system. It helped to enable pull flow production ( producing based on the demand of the next process or customer) or just-in-time production. It was used to limit queue or regulate inventory.
The concept of Kanban was customized to be used in Project management. Agile projects visualize workflow, limit work in progress, identify bottlenecks through Kanban boards and thereby increase efficiency
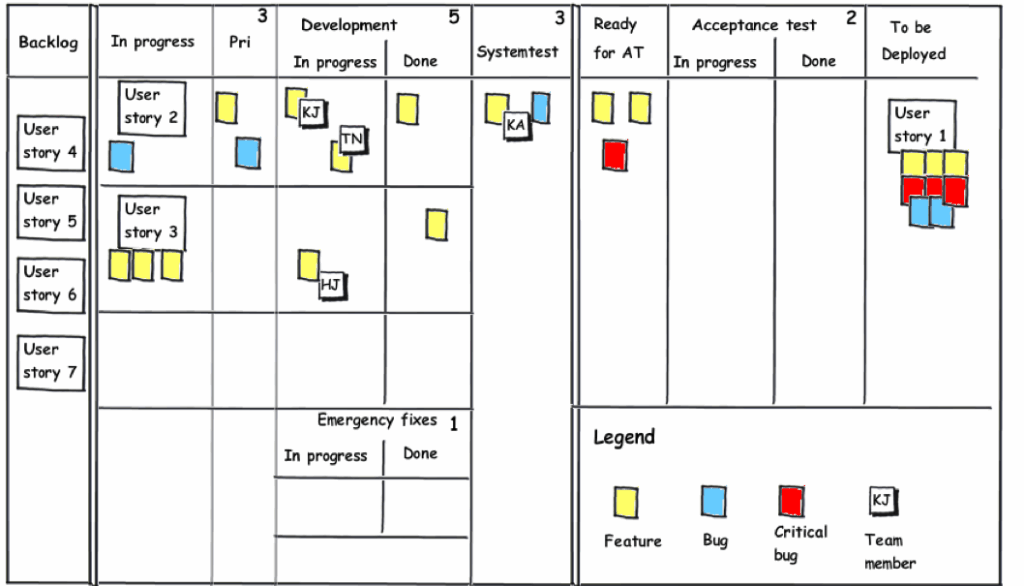
Fig 3 : Kanban Board
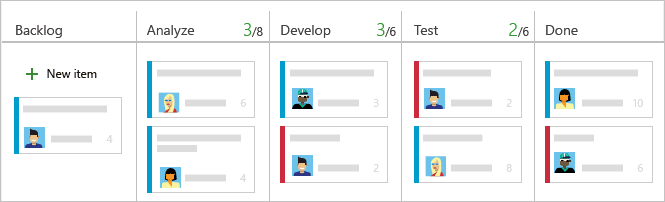
Fig 4 : Azure Task Board
Figure 4 : Azure Task Board
3. Burn Up and Burn Down Charts :
These charts helps the team to track their progress and adjust their velocity ( number of story points completed in one iteration)
The burn down chart shows how much work or story points are remaining while burnup chart shows how much work or story points are done. Burn up chart also shows the change in scope ( reduction or addition of stories)
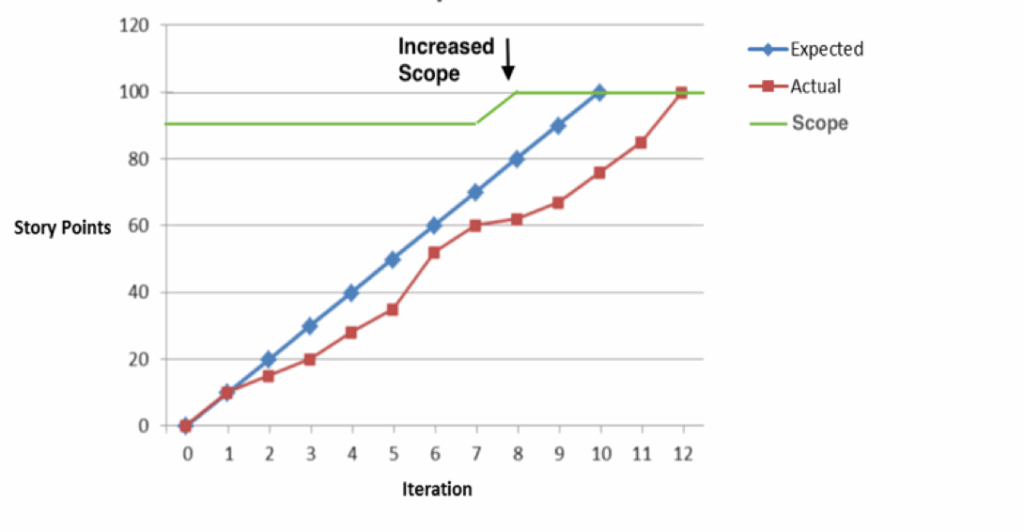
Fig 5 : Burn Down Chart
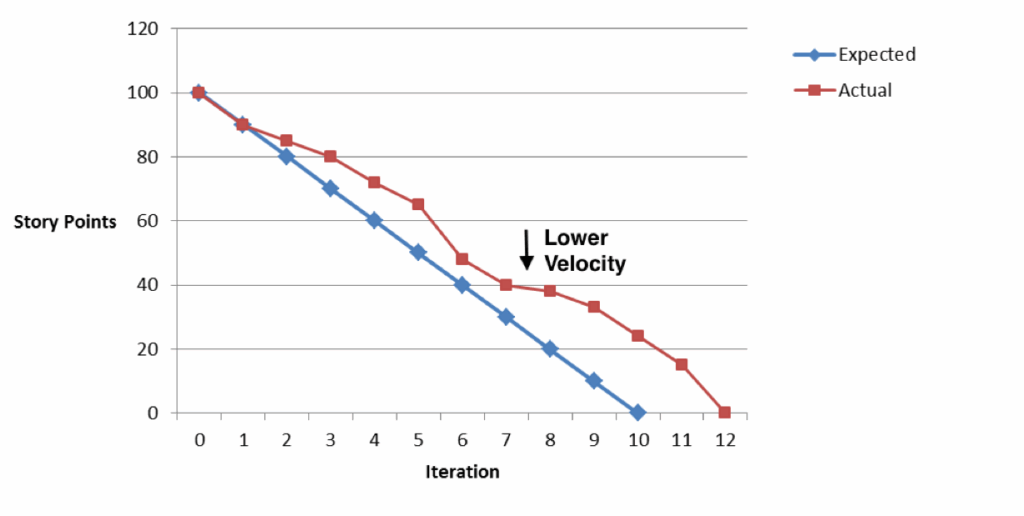
Fig 6 : Burn Up Chart
4. Cumulative Flow Diagrams :
This diagram shows the work in progress ( WIP) in a graphical form. In other words , it visualizes your Kanban board in a graphical form. It shows the stability of your process and showcase weakness.
In the following graph, the horizontal axis represents time , vertical axis represents cumulative number of cards in the work flow Kanban lanes at various intervals.
The three bands ( you can use more than three bands representing each stage in the Kanban board ) represents to-do (red), In progress ( blue) and done ( green)
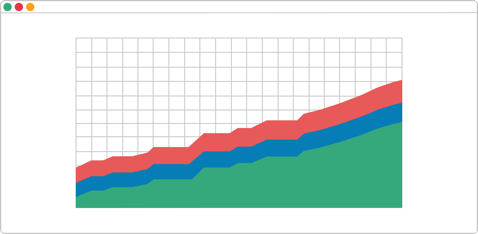
Fig 7 : Bands Progressing in Parallel represents Stable workflow
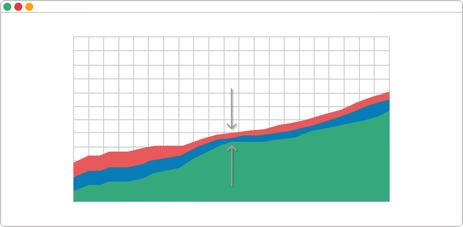
Fig 8 : Bands continuously narrowing down represents higher throughput
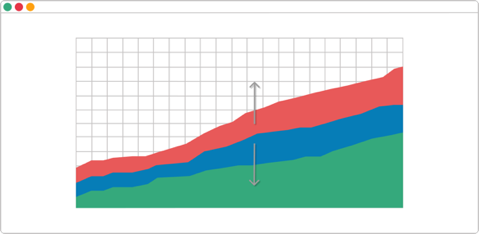
Fig 9 : Bands continuously widening represents lesser throughput and bottlenecks
5. Agile ROAM Boards : ROAM model is a risk management approach to help organizations identify and deal with uncertainties. ROAM stands for Resolve, Own, Accept, Mitigate – the four responses to manage risks.
Resolved – The team agrees that the risk is no longer a concern and is eliminated
Owned – Someone in the team is assigned to resolve the risk
Accepted – Some risks have to simply acknowledged, understood and accepted
Mitigated – The team develops a plan to reduce the impact of the risk.
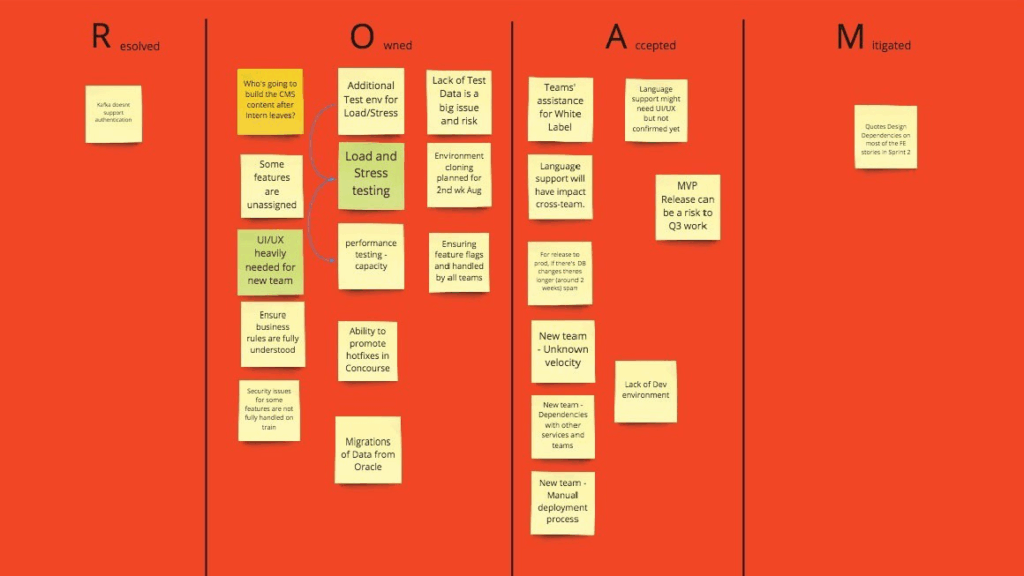
ROAM Boards aids in transparent assessment and ensuring the team is aware and aligned in handling risks.
Benefits of Information Radiators
Transparency : As Dourish and Belloti describe “ Awareness is understanding the activities of others , which provide context for your own activity” , These ubiquitous charts improves informedness of the team. This Low tech High touch tools are best to share information in a concise yet effective manner.
Accountability : It encourages the team to openly discuss problems and their root cause. It brings obstacles to team’s focus rather than blaming. It brings uncomfortable bad news to discussion and promote discussions during retrospective where the team members reflect on what went right or wrong to adjust their own behavior.
Collaboration : Creating, maintaining and updating these physical artifacts . It helps the team to think, plan, visualize workflow.it eliminates long hours spent in preparing status reports and supports collaborative decision making. It enable collaboration not only among the team members but also with the customers
History of the Information Radiators : 1980s – Visual Management: The concept of visual control and visual management originated in Japan...
PMI® has announced that starting 1st July 2020, the PMP® exam will reflect new content and the last day to take...

Lean is a quality improvement model that improve processes by removing waste or non-value added activities. Lean achieves this by...
As we kick off 2022, COVID-19 saga with its novel variants continues to throttle traditional working environment and challenges organizations...
Over the past few decades the world has realized that traditional (waterfall) way of managing projects does not fit the...
The concept of Agile also is one such adaptation that arose as a response to rapid change, growing complexity and...